Hoey's Basin: Subsurface Geology, Subsidence, and Flooding in Greater New Orleans
Hoey’s Basin is a drainage basin located on the east bank of the Mississippi River in Jefferson Parish, Louisiana. There are approximately 6,600 households, housing about 15,000 people within the outline of the basin (fig 2). Since 1978 FEMA’s National Flood Insurance Program has paid over $30,000,000 in flood claims to homeowners in Hoey’s Basin. There are 164 properties on FEMA’s repetitive loss list, meaning they have flooded more than twice in any ten year period, and of those there are 17 properties on the severe repetitive loss list, meaning they have flooded more than four times or they have combined claims that exceed the value of the property (UNO Center for Hazards Assessment, 2007)
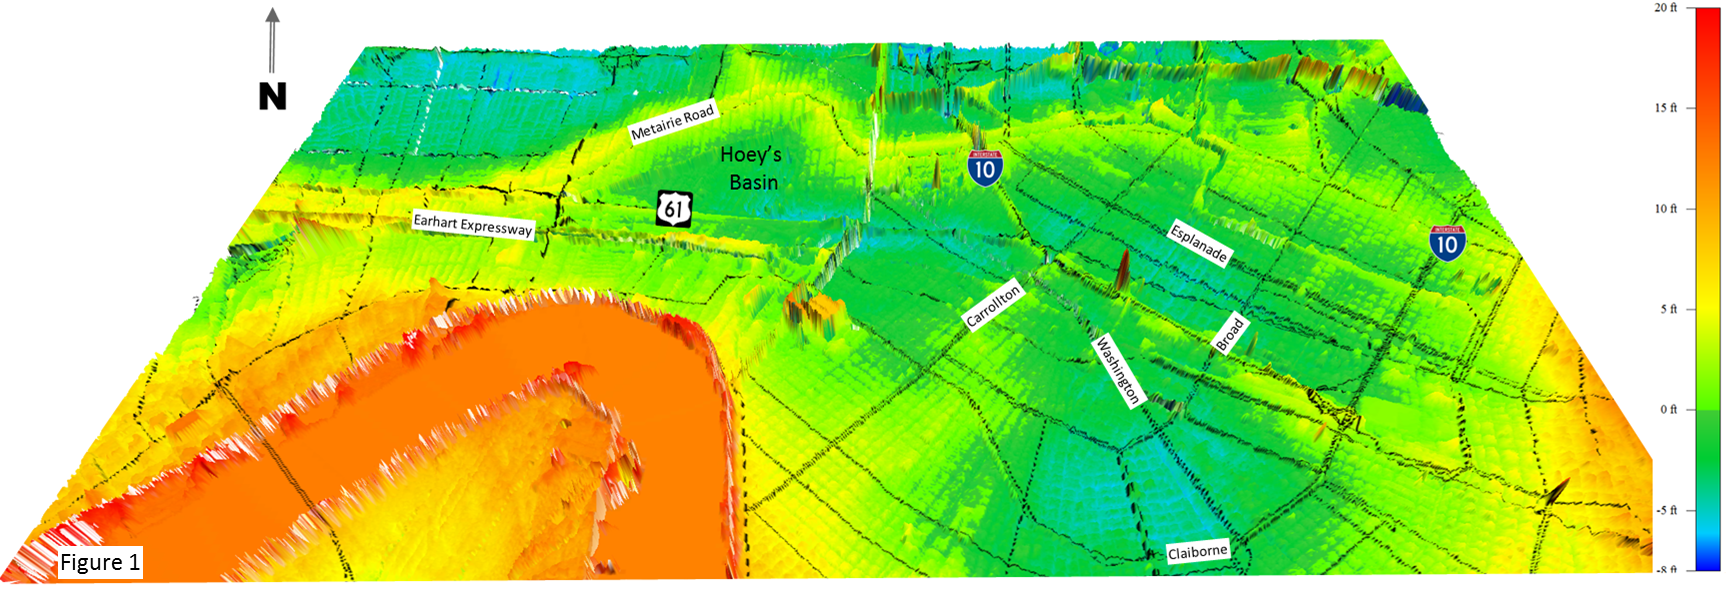
A recent study by researchers at the Jet Propulsion Laboratory, UCLA, and the LSU Center for GeoInformatics (Jones et al, 2015) identified Hoey’s Basin as a “subsidence bowl”. The bowl-shaped depression of the Earth’s surface can be clearly seen on LIDAR digitial elevation models, with elevations between 1 and 8 feet below sea level (figs 1, 3, 8). The study also used InSAR satellite technology to measure changes in surface elevation across the Greater New Orleans area. InSAR satellites reflect radar off of the surface of the earth to make very accurate elevation measurements. By comparing elevation measurements taken on June 16, 2009 and July 2, 2012, the study determined that Hoey’s Basin had subsided at average rates between 10 and 20 millimeters per year (about 4 to 8 inches per decade) during that time period.


Flooding in the basin is generally caused by rainwater that accumulates in the center of the bowl, and has to be pumped out. When rainfall rates exceed the capacity of the system of drainage canals and pumps to move water, flooding occurs (fig 4). The costliest floods in Hoey’s Basin were associated with rain events in May 1983 and May 1995, as well as flooding caused by the levee breaches after Hurricane Katrina in 2005. If subsidence rates in the basin were sustained for any significant period of time, the depth of the bowl could increase, and the problem of flooding could potentially become worse.
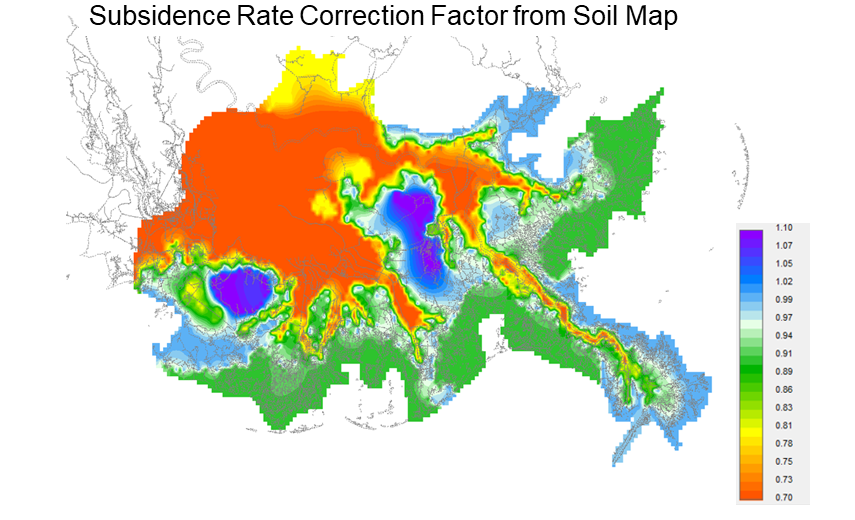
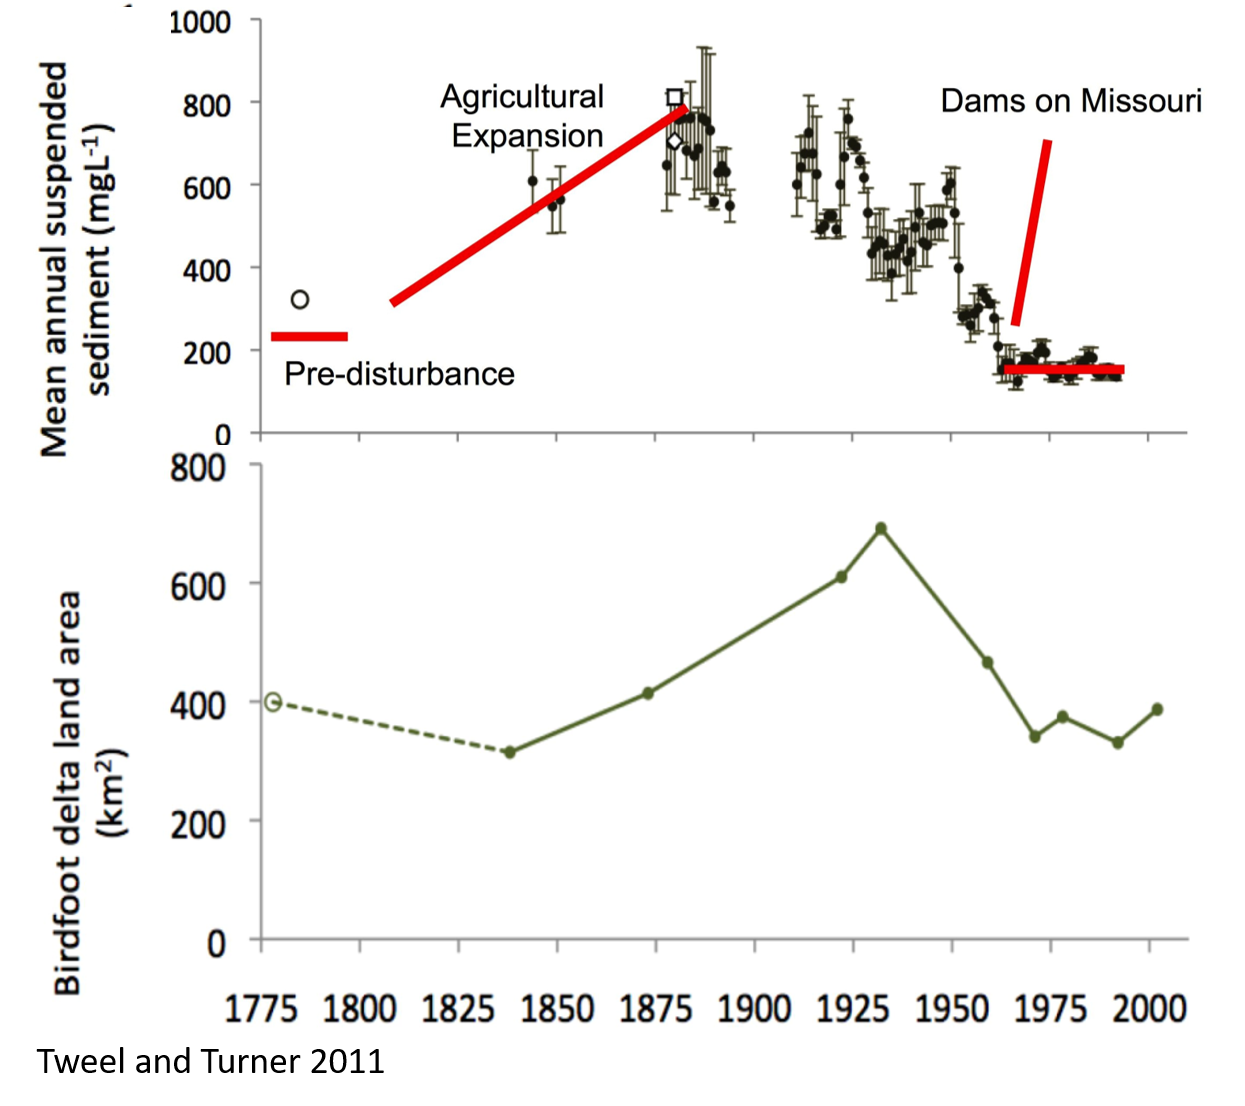
There are a number of potential causes for subsidence in southeast Louisiana, but a study by the Louisiana Coastal Restoration and Protection Authority (Byrnes et al, 2021) found that the consolidation of Holocene sediments is the primary contributor. The variation of subsidence rates across the delta plain tends to be positively correlated with variations in the thickness and composition of the underlying Holocene sediments. The Holocene Epoch corresponds to the most recent interglacial cycle, which began about 11,650 years ago. During the preceding glacial cycle much of continental North America was covered with thick ice sheets, and sea level was a much as 400 feet lower than it is at present. This low sea level event exposed all of south Louisiana, and much of the adjacent continental shelf to erosion. The exposed surface was a firm Pleistocene clay, and erosion cut down into the clay creating a hilly topography incised by a drainage system of valleys and gullies.


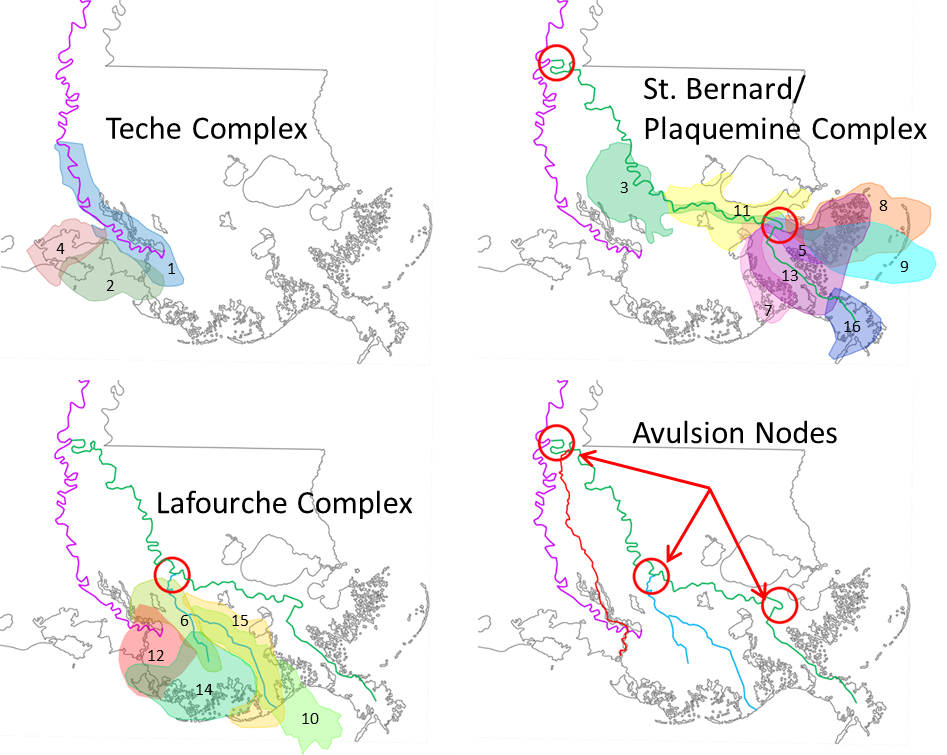
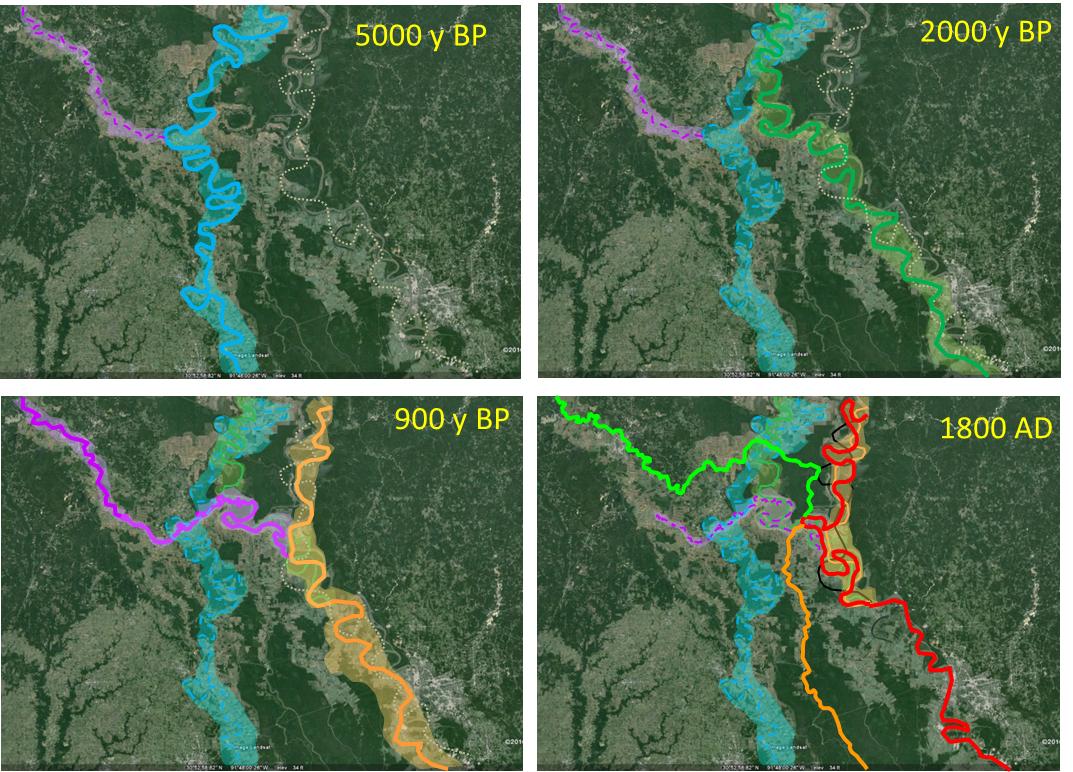
As the ice sheets melted, this topography was progressively drowned by rising sea level. Sea level reached its current elevation about 6,000 years ago, and most of south Louisiana was covered by shallow bays. The sixteen historical deltas of the Mississippi River then spread then out across the area filling in the Pleistocene topography and building the coastal wetlands (Frazier, 1967). The Holocene sediments beneath New Orleans are a combination of near shore bay, pro-delta, barrier island, natural levee and distributary channel deposits (fig 6). The three most significant Holocene deposits below New Orleans are the Pine Island beach/barrier island, the Bayou Sauvage distributary channel natural levee, and thick layers of highly organic peat that are nearest to the surface. The barrier island and channel deposits closely coincide with each other, and it is likely that the pre-existing barrier island controlled the orientation of the channel. Together these deposits of competent fine to coarse sands make of the backbone of the Metairie-Gentilly ridge. This feature has a very clear expression on LIDAR, and forms the northern boundary of Hoey’s Basin (fig 1, 2, 13). Metairie Road and Gentilly Boulevard were constructed along the crest of the ridge. The thick peat layers flank most of either side of the ridge. These are the result of marsh and swamp deposits along the ancestral river channel (fig 6).

The positive correlation of subsidence with the thickness and composition of the Holocene deposits in Greater New Orleans is generally attributed to composition. The barrier island and natural levee deposits are generally resistant to subsidence, and the depth of flood waters associated with Hurricane Katrina was generally lowest along the crests of these features (fig 7). Conversely, highly organic peat layers are very compactible, and there is a strong correlation between the lowest elevations in the area, the deepest flood waters and the thickness of peat (figs 2, 5 & 7). It is commonly recognized that the rate of subsidence in areas underlain by thick peat deposits was accelerated by the system of drainage canals across the area (fig 4). The canals cut down into the peat deposits, and for many years a low water level in the canals was maintained by the pumps. It was realized that this caused the peat layers to drain into the canals causing them to dry out and oxidize. The oxidation of the peats was causing them to compact and subside at an accelerated rate. The New Orleans Urban Water Plan has proposed a plan to increase the water level elevations in the canals to reduce the rate of subsidence caused by oxidation of the peats.


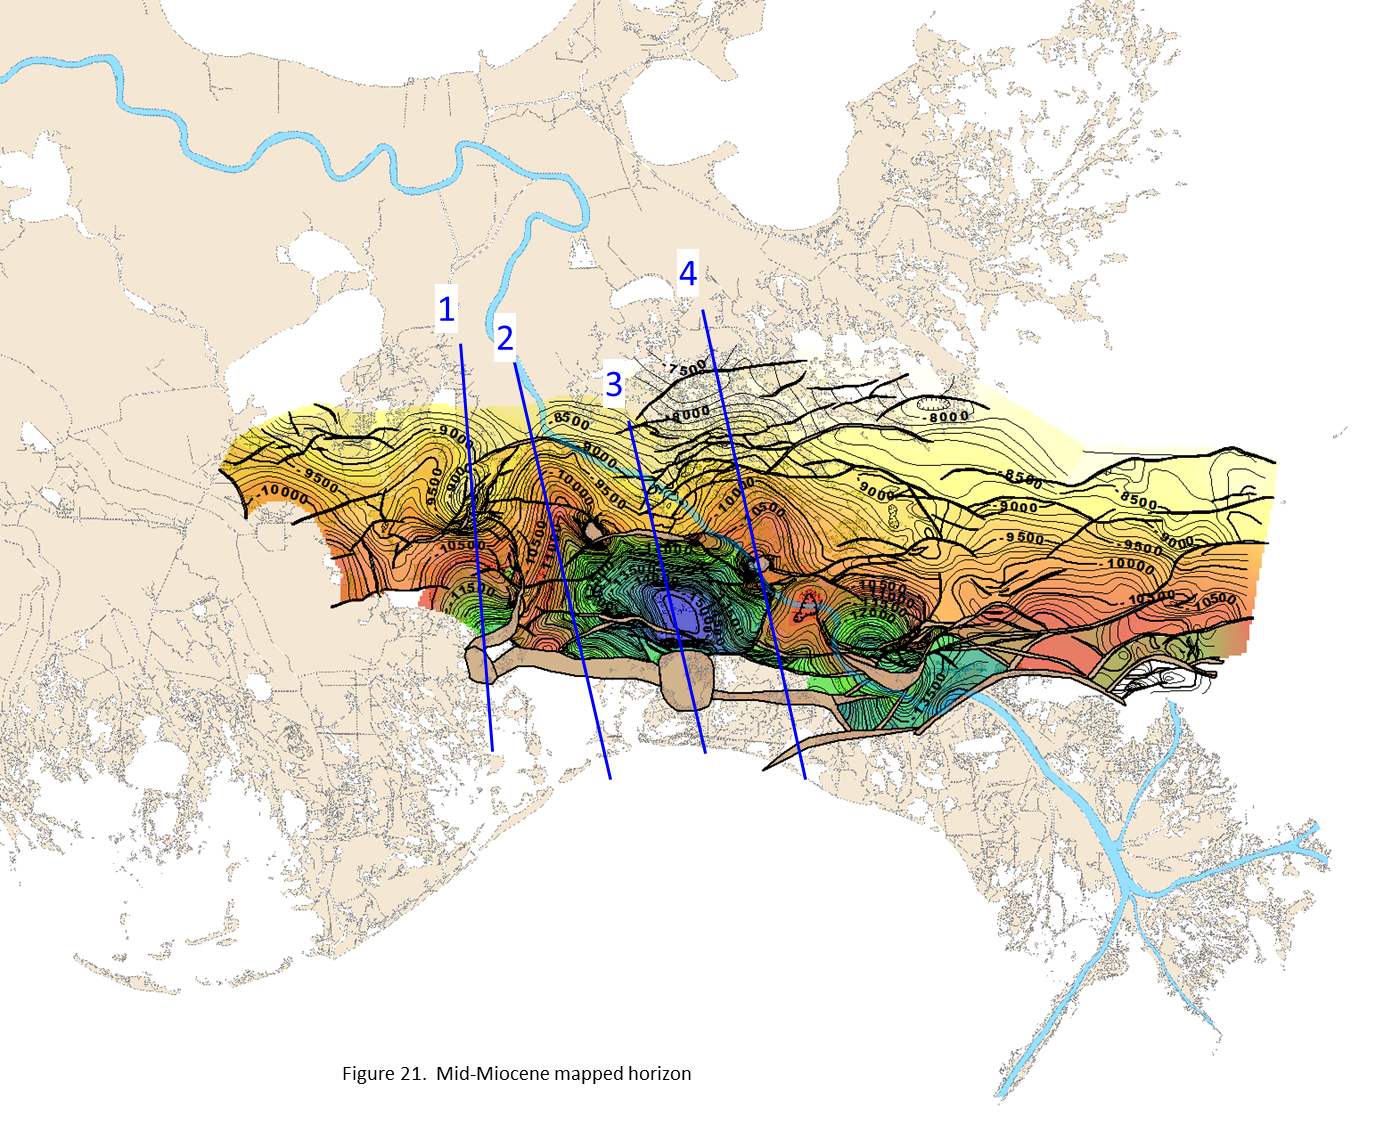
What is interesting about Hoey’s Basin is that it does not fit the positive correlation between the composition of the Holocene and subsidence rate. Peat layers are relatively thin under the basin, and it seems unlikely that peat compaction is a significant cause of the subsidence measured by Jones et al, 2015. This subsidence pattern does, however, appear to have a strong correlation with the total thickness of the Holocene. A relatively high density of cores and borings that reach the Pleistocene surface has allowed for detailed mapping of the depth of the surface and the thickness of Holocene deposits that overlie it. The map published by Saucier (1963) shows his interpretation of a deep erosional gully crossing Greater New Orleans (figs 8, 9 & 10). The outline of this erosional feature has a strong correlation with the outline of subsidence rates measured by Jones et al, 2015 at Hoey’s Basin. Figure 11 shows a profile of borings used by Saucier, 1963. The Holocene deposits are 30 to 40 feet thicker within the feature than they are on either flank. A LIDAR elevation profile shows a strong correlation between the elevation of the Pleistocene surface (the thickness of the Holocene) and the elevation at the surface. It appears plausible that combination of the thickness and composition of the Holocene interval within the bounds of the erosional gully may have accounted for the cumulative subsidence that formed Hoey’s Basin at the surface, and the short-term subsidence rates measured by Jones et al, 2015. One possible explanation is that the Bay/Sound deposits that represent the early infilling of the gully, and are not present on the flanks, may be more compactable than other deposits. Jones et al, 2015 also considered the possibility that the Holocene deposits undergo an exchange of water with the Mississippi River which causes a variation in subsidence rates that coincides with river stage.


A significant portion of the processes that are occurring at the surface across south Louisiana are influenced by subsurface processes. Continuing to expand our understanding of subsurface geology will help to better understand processes at the surface, and how to predict how they may vary in the future.
REFERENCES
Byrnes, M.R., Hollis, R.J., Britsch, L.D., Berlinoff, J.L., Johnson, R., 2021, Recent Subsidence Trends for Southeastern Louisiana Derived from Static GPS Measurements at Primary and Secondary Benchmarks, La. C.P.R.A.
Frazier, D.E., 1967, Recent deltaic deposits of the Mississippi River: their development and chronology, Trans. G.C.A.G.S., v. 17, p. 287‐315
Jones, C.E., An, K., Blom, R.G., Kent, J.D., Ivins, E.R., Bekaert, D., 2015, Anthropogenic and geological influences on subsidence in the vicinity of New Orleans, Louisiana, Journal of Geological Research, Solid Earth, 121
Saucier, R.T., 1963, Recent Geomorphic History of the Pontchartrain Basin, L.S.U. Press
UNO-CHART Repetitive Loss Project Team, 2007, A Review of Repetitive Floodloss Data for Hoey’s Basin, Jefferson Parish, Louisiana